
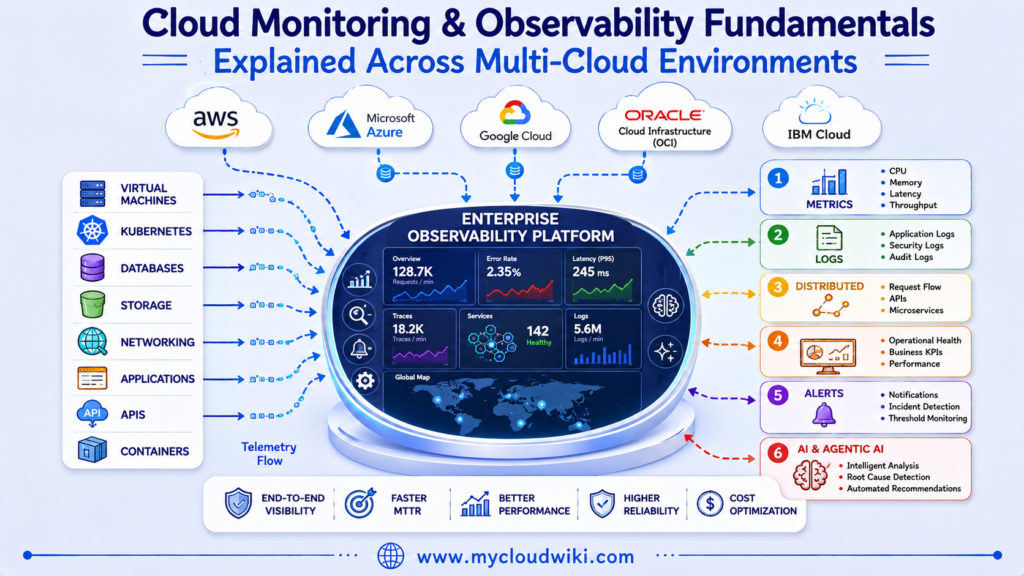
Quick Read
- ✅ Cloud monitoring collects operational data from cloud infrastructure, applications, and services to help engineers detect and respond to issues quickly.
- ✅ Observability extends monitoring by combining metrics, logs, traces, and contextual insights to understand why systems behave the way they do.
- ✅ Every major cloud provider offers monitoring and observability services, but enterprise organizations standardize operational practices across all cloud environments.
- ✅ Cloud engineers build monitoring solutions and investigate operational issues, while architects design enterprise observability strategies that support governance, reliability, security, and business operations.
- ✅ AI and Agentic AI are transforming cloud operations by analyzing telemetry, detecting anomalies, assisting incident response, and automating operational workflows while maintaining governance and human oversight.
In the previous lesson, you learned how Cloud Automation Fundamentals Explained Across Multi-Cloud Environments enables organizations to provision infrastructure, deploy applications, and manage cloud operations consistently using Infrastructure as Code, CI/CD, GitOps, Configuration Management, and Orchestration.
However, automation alone cannot guarantee operational success. Once applications and infrastructure are deployed, organizations need continuous visibility into system health, performance, availability, and user experience.
Cloud Monitoring and Observability provide that visibility by collecting operational data, identifying problems early, and helping engineers understand what is happening inside complex cloud environments.
Cloud Monitoring & Observability Introduction
Modern enterprise cloud environments generate enormous amounts of operational data every second. Virtual machines, containers, databases, networks, APIs, storage systems, and applications continuously produce information about their health and performance.
Without effective monitoring, engineers often discover problems only after users report service disruptions.
Cloud monitoring continuously collects and analyzes operational data to detect failures, measure performance, and notify engineering teams when issues occur.
Observability builds upon monitoring by helping engineers answer questions such as:
- What failed?
- Why did it fail?
- Which services were affected?
- How can we resolve the problem?
- How can we prevent similar incidents?
Together, monitoring and observability enable organizations to operate cloud platforms confidently while maintaining reliability, performance, security, and business continuity.
💡 Architect’s Tip
Many organizations invest heavily in dashboards but still struggle during production incidents. Enterprise observability is not about collecting more telemetry—it is about collecting the right telemetry and correlating it quickly so engineers can understand the business impact and resolve issues faster.
The following illustration introduces monitoring and observability as the operational visibility layer that continuously collects, analyzes, and correlates telemetry across enterprise cloud environments.
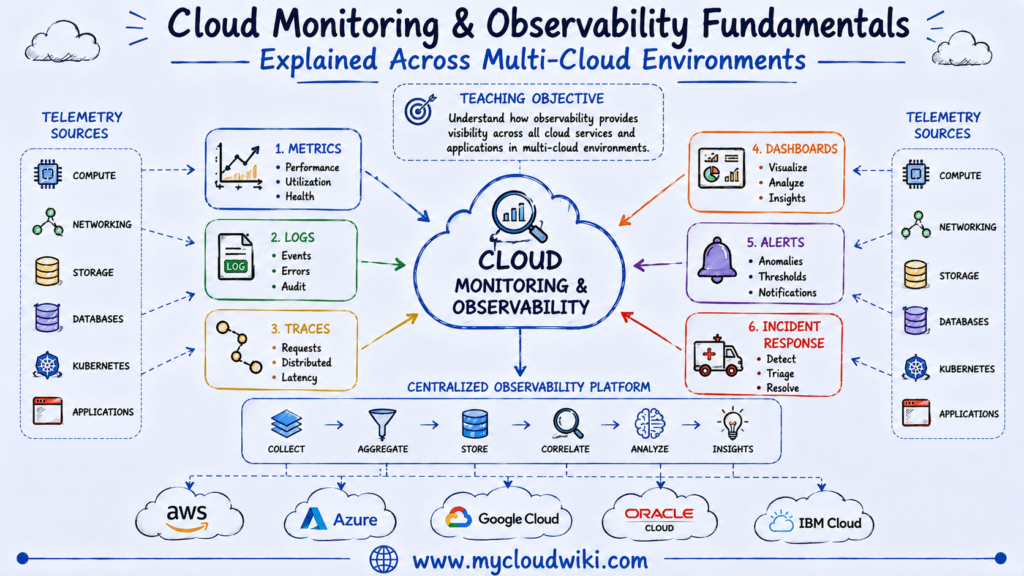
Cloud monitoring continuously collects operational telemetry, while observability correlates that information to help engineers understand system behavior. Together, they provide the operational intelligence required to manage modern enterprise cloud platforms.
Learning Objectives
After completing this lesson, you will be able to:
- Explain the purpose of cloud monitoring and observability.
- Differentiate monitoring from observability.
- Understand the role of metrics, logs, traces, alerts, and dashboards.
- Compare monitoring capabilities across the major cloud providers.
- Understand how AI and Agentic AI improve operational visibility while maintaining enterprise governance.
What Is Cloud Monitoring?
Cloud monitoring is the continuous collection, measurement, visualization, and analysis of operational data generated by cloud infrastructure, applications, services, and networks.
Monitoring helps engineering teams answer important operational questions such as:
- Is the application available?
- Are response times increasing?
- Is CPU utilization unusually high?
- Is storage approaching capacity?
- Are security events occurring?
- Have deployment failures occurred?
Monitoring platforms continuously evaluate these signals and notify engineers before problems become major business incidents.
💡 Architect’s Tip
Monitoring should focus on business-critical services rather than collecting every possible metric. Prioritize the telemetry that helps engineering teams detect issues quickly and understand customer impact.
What Is Observability?
Observability goes beyond monitoring by helping engineers understand why systems behave the way they do.
Instead of viewing metrics independently, observability combines multiple telemetry sources to provide a complete picture of application behavior and infrastructure health.
Observability typically combines:
- Metrics
- Logs
- Traces
- Events
- Dependencies
- Contextual metadata
By correlating these data sources, engineers can investigate complex failures more efficiently and reduce the time required to restore services.
Continue Learning: The telemetry collected through observability also supports Cloud Reliability & High Availability Fundamentals, enabling proactive detection of failures and faster recovery across enterprise cloud environments.
Core Cloud Monitoring & Observability Technologies
Cloud monitoring and observability are not individual products—they are collections of complementary capabilities that work together to provide complete operational visibility across cloud infrastructure, applications, networks, and services.
Each capability answers a different operational question. Together, they enable engineering teams to detect issues quickly, investigate failures efficiently, understand application behavior, and continuously improve platform reliability.
The five foundational monitoring and observability technologies are:
- Metrics
- Logs
- Distributed Tracing
- Dashboards & Alerts
- OpenTelemetry
Understanding how these technologies complement one another is essential for operating enterprise cloud platforms across the major cloud providers.
Metrics
Metrics are numerical measurements collected over time that describe the health, utilization, availability, and performance of cloud resources and applications.
Metrics help engineering teams quickly identify operational trends and detect abnormal system behavior before users experience service disruptions.
Common cloud metrics include:
- CPU utilization
- Memory utilization
- Network throughput
- Disk I/O
- Request latency
- Error rates
- Database connections
- Storage utilization
Metrics provide a high-level operational view and are often the first indication that a system requires attention.
💡 Architect’s Tip
Enterprise monitoring should prioritize business-critical metrics rather than collecting every available measurement. Well-designed metrics help engineers identify customer impact quickly while reducing unnecessary operational noise.
The following illustration demonstrates how metrics continuously measure the health and performance of cloud infrastructure and applications.
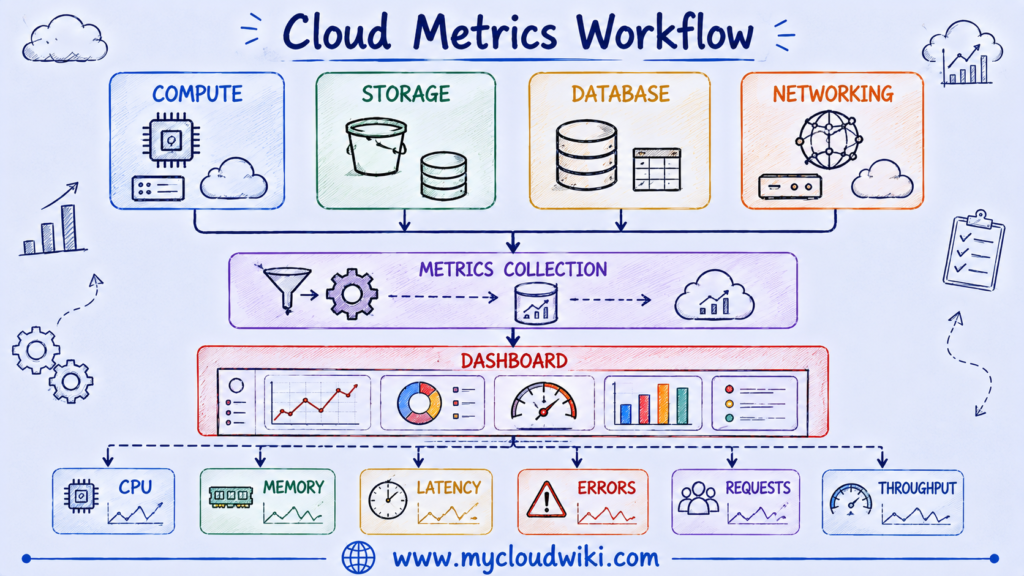
Metrics provide continuous visibility into operational health, allowing engineering teams to identify performance trends and detect potential issues before they impact users.
Logs
Logs are detailed records of events generated by cloud infrastructure, operating systems, applications, databases, security platforms, and cloud services.
Unlike metrics, which summarize system health, logs explain exactly what happened during a particular event or transaction.
Typical log information includes:
- Application errors
- User authentication
- API requests
- Security events
- Infrastructure changes
- Deployment activities
- Audit records
- System events
Logs provide the detailed evidence engineers need to investigate incidents and understand the sequence of events leading to a problem.
💡 Architect’s Tip
Centralize logs across all cloud providers whenever possible. During major production incidents, engineers should investigate one trusted logging platform instead of manually searching multiple cloud consoles.
The following illustration demonstrates how centralized logging simplifies operational investigations across enterprise cloud environments.
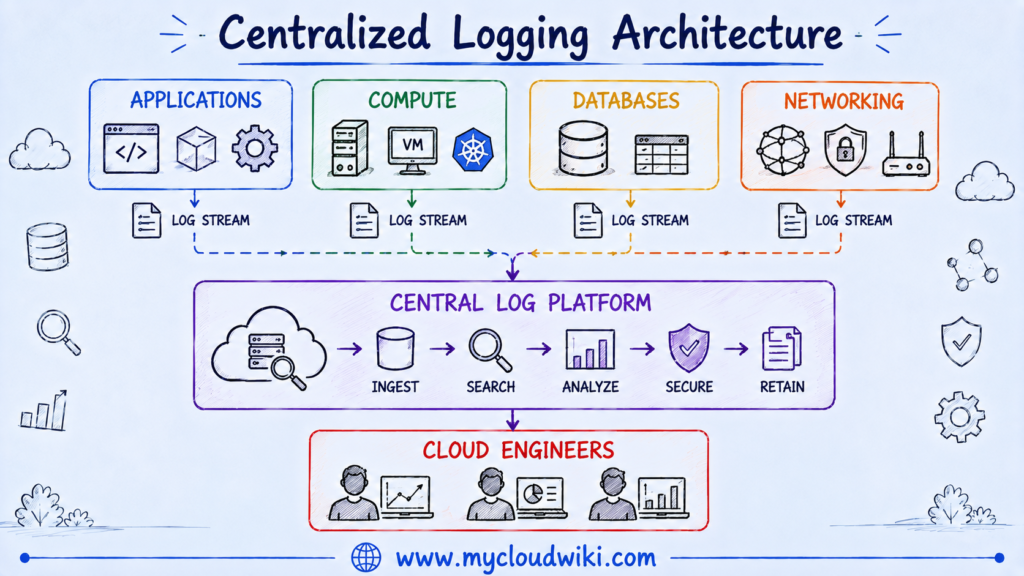
Centralized logging improves operational efficiency by giving engineers a single source of truth for investigating incidents across enterprise cloud environments.
Distributed Tracing
Distributed tracing follows a single request as it travels through multiple cloud services, APIs, databases, and microservices.
Modern cloud-native applications often consist of dozens or even hundreds of interconnected services. When performance issues occur, tracing helps engineers identify exactly where requests slow down or fail.
Distributed tracing helps answer questions such as:
- Which service introduced latency?
- Which dependency failed?
- How long did each service take?
- Where did the request stop?
- Which downstream systems were affected?
Tracing is especially valuable for:
- Kubernetes
- Microservices
- APIs
- Serverless applications
- Event-driven architectures
💡 Architect’s Tip
As enterprise applications become increasingly distributed, request tracing becomes one of the most valuable observability capabilities because it reveals how services interact rather than simply reporting infrastructure health.
The following illustration follows a single user request across multiple cloud services to identify performance bottlenecks.
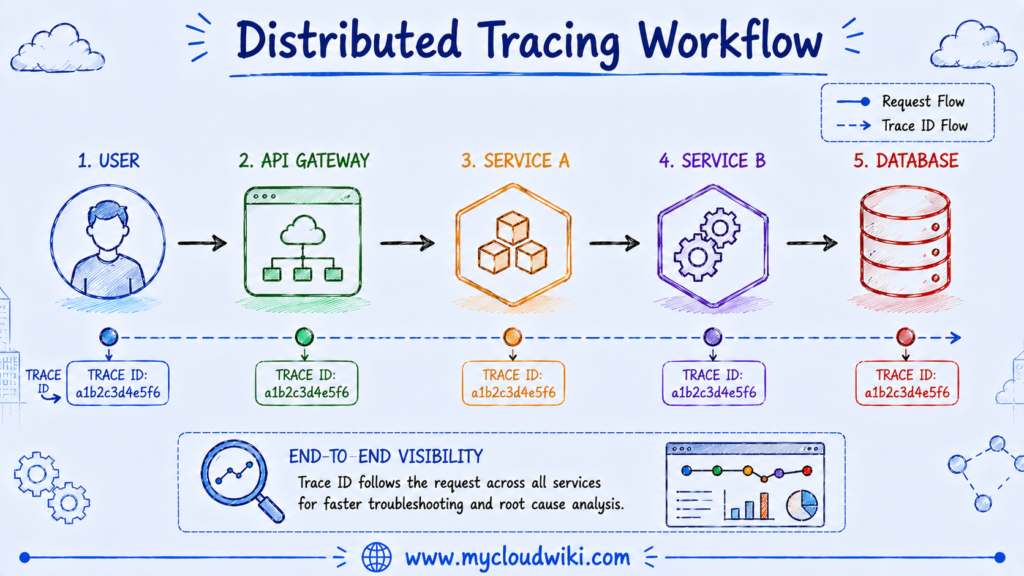
Distributed tracing provides end-to-end visibility into application requests, making it significantly easier to diagnose performance issues within modern distributed cloud applications.
Dashboards & Alerts
Dashboards transform operational telemetry into visual insights, while alerts notify engineering teams when predefined thresholds or conditions are exceeded.
Together, they allow organizations to move from reactive troubleshooting to proactive operations.
Typical dashboards display:
- Infrastructure health
- Application availability
- Service latency
- Error rates
- Capacity trends
- Business KPIs
Alerts automatically notify engineering teams when:
- Response times increase
- Error rates exceed thresholds
- Resources become unavailable
- Capacity reaches critical levels
- Security events occur
Well-designed dashboards and alerts help engineering teams identify and respond to incidents before they affect business operations.
💡 Architect’s Tip
Avoid creating dashboards that simply display data. Enterprise dashboards should support operational decisions, while alerts should notify engineers only when meaningful action is required to prevent alert fatigue.
The following illustration demonstrates how dashboards and alerts convert telemetry into actionable operational intelligence.
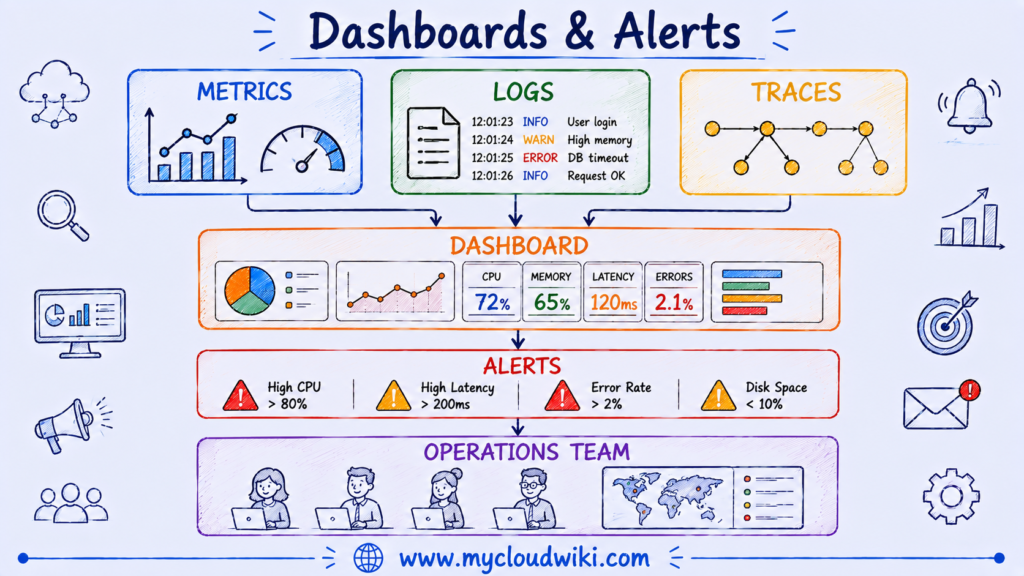
Dashboards provide operational visibility, while alerts enable engineering teams to respond proactively to issues before they become major business incidents.
OpenTelemetry
OpenTelemetry is an open-source observability framework that standardizes how telemetry data is collected, processed, and exported across cloud applications and infrastructure.
Rather than building different telemetry collection mechanisms for every cloud provider or monitoring platform, organizations instrument their applications once using OpenTelemetry. The collected telemetry can then be sent to one or more observability platforms for analysis.
OpenTelemetry supports the three primary types of telemetry data:
- Metrics
- Logs
- Distributed Traces
This standardized approach helps organizations avoid vendor lock-in while simplifying observability across hybrid and multi-cloud environments.
Key benefits of OpenTelemetry include:
- Standardized telemetry collection.
- Consistent instrumentation across applications.
- Multi-cloud compatibility.
- Reduced vendor lock-in.
- Easier migration between observability platforms.
- Better support for cloud-native applications.
- Improved interoperability between monitoring tools.
As enterprise organizations continue adopting multi-cloud strategies, OpenTelemetry has become an important foundation for building portable and consistent observability architectures.
💡 Architect’s Tip
Instrument applications once and keep your telemetry portable. Standardizing on OpenTelemetry allows organizations to evolve monitoring platforms over time without requiring application teams to repeatedly change instrumentation code.
The following illustration demonstrates how OpenTelemetry collects metrics, logs, and traces from applications before exporting them to enterprise observability platforms.
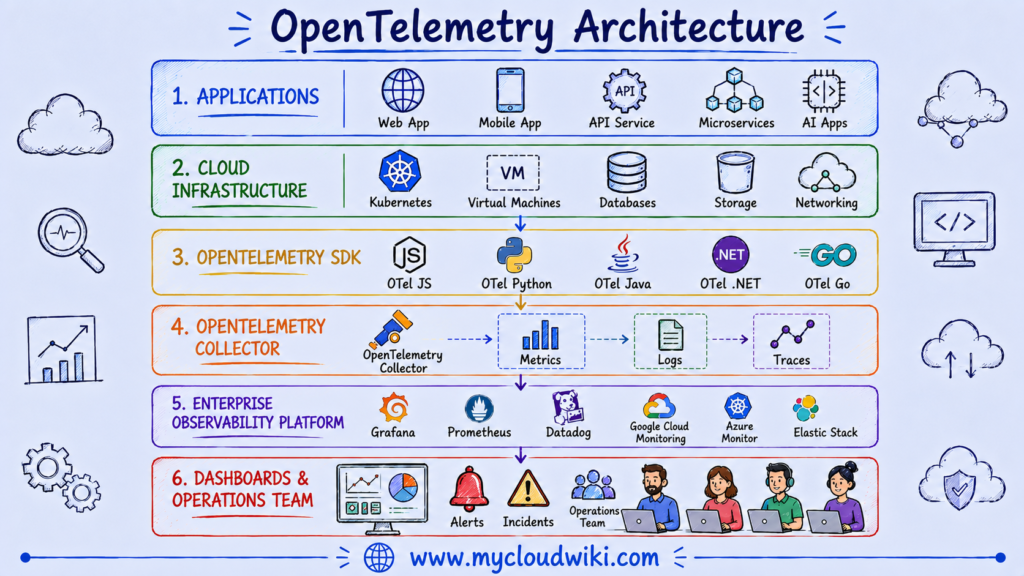
OpenTelemetry provides a common telemetry foundation that simplifies monitoring and observability across the major cloud providers while giving organizations the flexibility to choose the observability platform that best meets their operational requirements.
Bringing Everything Together
Monitoring and observability technologies are most effective when they work together as a unified operational platform rather than as independent tools.
Each technology contributes a unique capability:
- Metrics measure the health and performance of cloud resources.
- Logs capture detailed operational events.
- Distributed Traces follow requests across applications and services.
- Dashboards & Alerts transform telemetry into operational awareness.
- OpenTelemetry standardizes telemetry collection across applications and cloud providers.
When combined, these capabilities provide complete visibility into enterprise cloud environments, enabling engineering teams to detect issues faster, investigate incidents more efficiently, and continuously improve operational reliability.
The following illustration summarizes how the five core monitoring and observability technologies work together to create a unified enterprise observability platform.
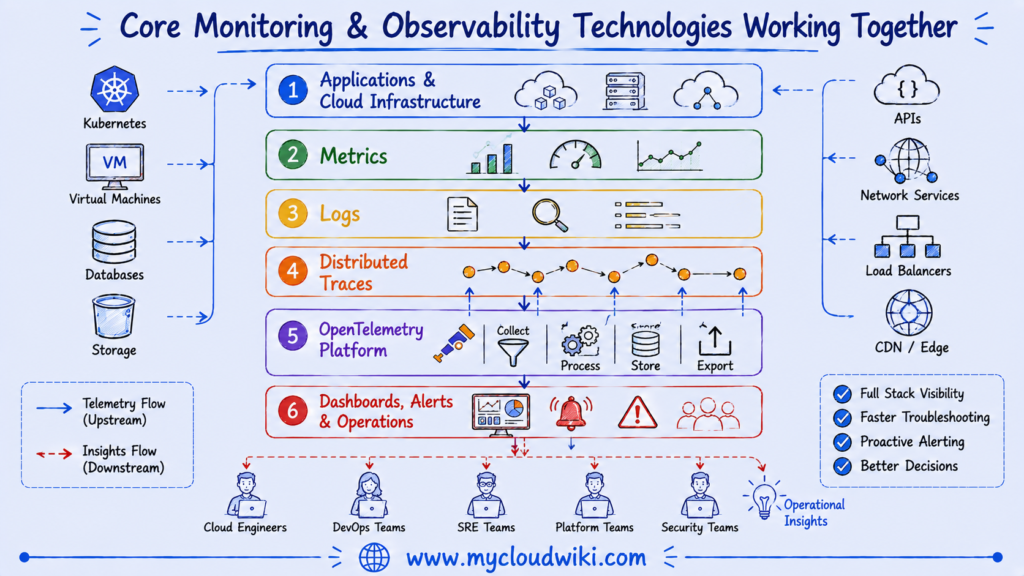
Monitoring and observability are not individual capabilities—they form an integrated operational platform. By combining metrics, logs, traces, dashboards, alerts, and OpenTelemetry, enterprise organizations gain the visibility needed to operate reliable, secure, and scalable cloud platforms across the major cloud providers.
Core Monitoring & Observability Technologies
Monitoring & Observability Across the Major Cloud Providers
Every major cloud provider offers native monitoring and observability services that collect telemetry, visualize operational health, generate alerts, and support troubleshooting. Although the service names differ, the underlying observability concepts remain consistent across providers.
Rather than relying entirely on provider-specific tooling, enterprise organizations typically standardize observability practices and integrate telemetry into centralized monitoring platforms. This approach improves operational consistency, reduces vendor lock-in, and simplifies cloud operations across multiple environments.
Common monitoring and observability capabilities include:
- Metrics collection
- Centralized logging
- Distributed tracing
- Dashboards
- Alerting
- Incident management
- Application Performance Monitoring (APM)
- OpenTelemetry integration
Continue Learning: Understanding Cloud Networking Fundamentals helps explain how network telemetry, latency, and traffic analysis contribute to enterprise observability across distributed cloud environments.
The following comparison highlights how the major cloud providers implement similar monitoring and observability capabilities using different services.
Monitoring & Observability Across the Major Cloud Providers
Although every cloud provider offers its own monitoring ecosystem, enterprise architects should focus on establishing common operational standards that span all cloud environments.
The following illustration compares monitoring and observability capabilities across the major cloud providers while emphasizing their shared architectural principles.
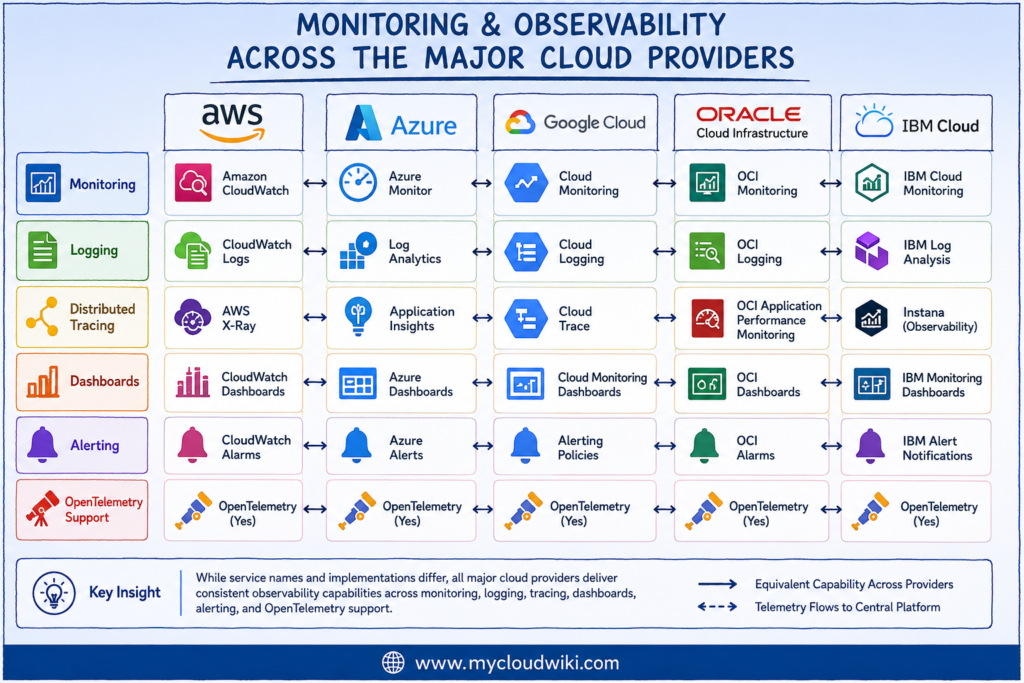
Although provider-specific implementations differ, successful enterprise observability strategies focus on standardizing operational processes, telemetry collection, and governance rather than individual cloud services.
Monitoring & Observability Through the Engineer and Architect Lens
Cloud engineers and enterprise architects both depend on monitoring and observability, but they use these capabilities to achieve different objectives.
Engineers focus on day-to-day operational health, troubleshooting, and incident response. Architects focus on designing an enterprise observability platform that supports governance, operational excellence, and long-term scalability across the major cloud providers.
Engineer Perspective
Cloud engineers use monitoring and observability to maintain healthy production environments and resolve operational issues quickly.
Typical responsibilities include:
- Creating dashboards.
- Configuring alerts.
- Investigating logs.
- Analyzing distributed traces.
- Troubleshooting application failures.
- Monitoring infrastructure health.
- Performing root cause analysis.
- Improving operational runbooks.
The engineer’s goal is to minimize downtime and restore services quickly when incidents occur.
Architect Perspective
Enterprise architects design the observability strategy that enables engineering teams to operate cloud environments consistently at scale.
Typical responsibilities include:
- Defining enterprise monitoring standards.
- Standardizing telemetry collection.
- Selecting observability platforms.
- Designing centralized logging architectures.
- Defining alerting strategies.
- Establishing governance for operational data.
- Supporting compliance and auditing.
- Integrating observability into platform engineering.
The architect’s objective is to create a unified observability platform that improves operational maturity across the organization.
💡 Architect’s Tip
Dashboards alone do not create observability. Enterprise architects should design standardized telemetry, centralized operational data, meaningful alerting, and consistent operational processes that allow engineering teams to investigate incidents using the same trusted platform.
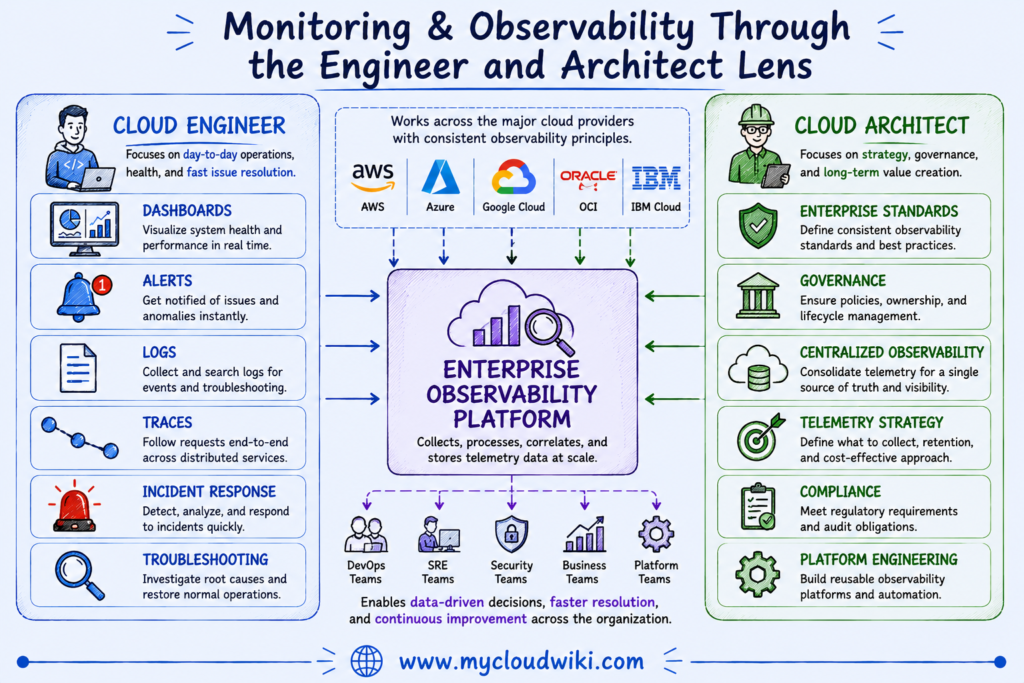
Monitoring and observability succeed when engineering execution and enterprise architecture work together. Engineers operate the platform, while architects ensure that every team benefits from a consistent, governed, and scalable observability strategy.
Monitoring & Observability in Multi-Cloud Environments
Operating multiple cloud providers significantly increases the complexity of monitoring and observability. Each provider generates telemetry using different services, formats, dashboards, and alerting mechanisms.
Without a standardized observability strategy, engineering teams must investigate incidents across multiple monitoring tools, increasing operational complexity and slowing incident resolution.
Enterprise organizations address this challenge by implementing a centralized observability platform that collects telemetry from every cloud provider and presents a unified operational view.
A mature multi-cloud observability strategy typically includes:
- Standardized telemetry collection using OpenTelemetry.
- Centralized logging.
- Unified dashboards.
- Common alerting standards.
- Cross-cloud distributed tracing.
- Standard operational runbooks.
- Integrated incident management.
- Governance for telemetry retention and access.
This approach enables engineering teams to investigate incidents consistently while improving operational efficiency across hybrid and multi-cloud environments.
Continue Learning: Cloud Security Fundamentals complements observability by showing how security monitoring, audit logging, and threat detection integrate into enterprise cloud operations.
The following illustration demonstrates how a centralized enterprise observability platform collects telemetry from multiple cloud providers to deliver a unified operational view.
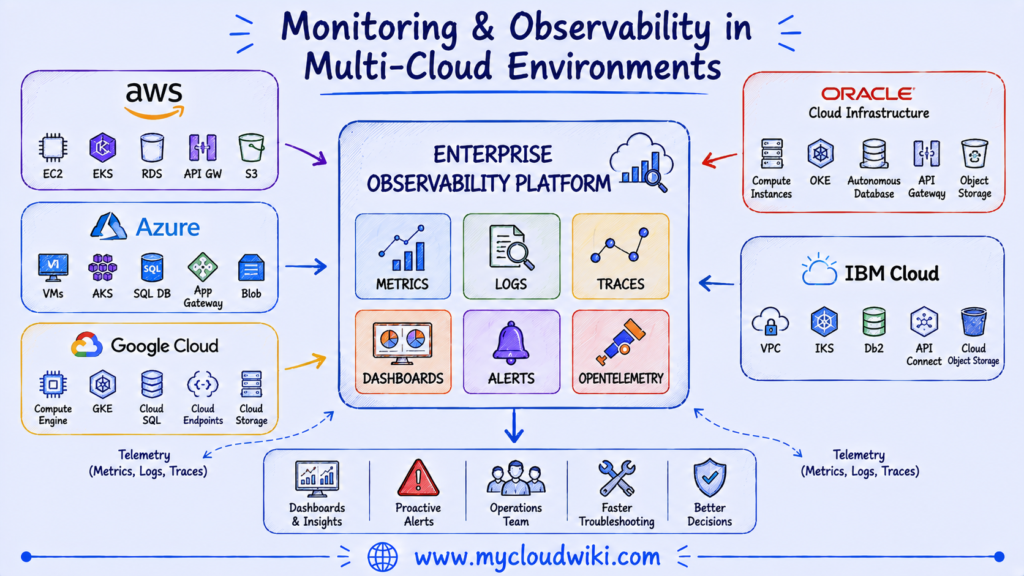
A centralized observability platform allows organizations to monitor, troubleshoot, and govern cloud environments consistently across the major cloud providers. By standardizing telemetry collection, dashboards, alerting, and operational processes, enterprises improve visibility, accelerate incident response, and strengthen operational resilience.
AI & Agentic AI for Cloud Monitoring & Observability
Cloud monitoring has traditionally focused on collecting telemetry, generating alerts, and helping engineers investigate operational issues. As cloud environments become increasingly distributed, Artificial Intelligence (AI) and Agentic AI are transforming how organizations monitor, analyze, and respond to operational events.
Rather than replacing existing monitoring platforms, AI enhances monitoring and observability by analyzing large volumes of telemetry, identifying patterns, correlating related events, and recommending actions that improve operational efficiency.
Agentic AI extends these capabilities further by coordinating approved operational workflows while operating within enterprise governance policies.
How AI Helps Cloud Monitoring & Observability
Artificial Intelligence improves monitoring and observability by analyzing operational telemetry at a scale that would be difficult for humans to achieve manually.
Common AI-assisted monitoring capabilities include:
- Detecting abnormal infrastructure behavior.
- Identifying performance bottlenecks.
- Correlating related alerts.
- Explaining application errors using telemetry.
- Summarizing logs during operational incidents.
- Identifying likely root causes.
- Predicting infrastructure capacity requirements.
- Recommending performance optimization opportunities.
By continuously analyzing metrics, logs, and traces, AI helps engineering teams detect operational issues earlier and reduce the time required to diagnose incidents.
How Agentic AI Helps Cloud Monitoring & Observability
Agentic AI goes beyond analyzing telemetry by coordinating operational activities using predefined enterprise policies and approval workflows.
Examples include:
- Collecting telemetry across multiple cloud providers.
- Investigating alerts automatically.
- Correlating metrics, logs, and traces.
- Opening incident tickets.
- Executing approved operational runbooks.
- Scaling cloud resources automatically when policy allows.
- Generating post-incident summaries.
- Recommending improvements to monitoring configurations.
Rather than replacing engineers, Agentic AI acts as an operational assistant that accelerates incident response while maintaining governance and accountability.
Governance
Monitoring platforms often process operational, business, and security data that must be protected appropriately.
Enterprise governance should include:
- Role-based access to operational telemetry.
- Centralized audit logging.
- Data retention policies.
- Alert governance standards.
- AI approval policies.
- Compliance monitoring.
- Operational reporting.
- Telemetry ownership and lifecycle management.
Strong governance ensures monitoring data remains accurate, secure, and trustworthy across enterprise cloud environments.
Human Oversight
Although AI and Agentic AI can automate many monitoring activities, cloud engineers and enterprise architects remain responsible for operational decisions.
Human oversight is especially important for:
- Major production incidents.
- Security investigations.
- High-risk remediation activities.
- Infrastructure architecture changes.
- Compliance exceptions.
- Business-critical operational decisions.
AI should support operational teams, while humans remain accountable for governance, risk management, and business outcomes.
Enterprise Perspective
Modern enterprise organizations increasingly combine monitoring, observability, AI, and automation into unified operational platforms.
Rather than simply reacting to incidents, organizations use intelligent observability platforms to detect issues proactively, recommend corrective actions, and continuously improve operational resilience across the major cloud providers.
💡 Architect’s Tip
The future of observability is intelligent, but not autonomous. AI should help engineers understand operational behavior and accelerate investigations, while enterprise governance and human oversight continue to guide production decisions and organizational accountability.
The following illustration demonstrates how AI and Agentic AI enhance monitoring and observability by analyzing telemetry, recommending actions, and supporting governed operational workflows.
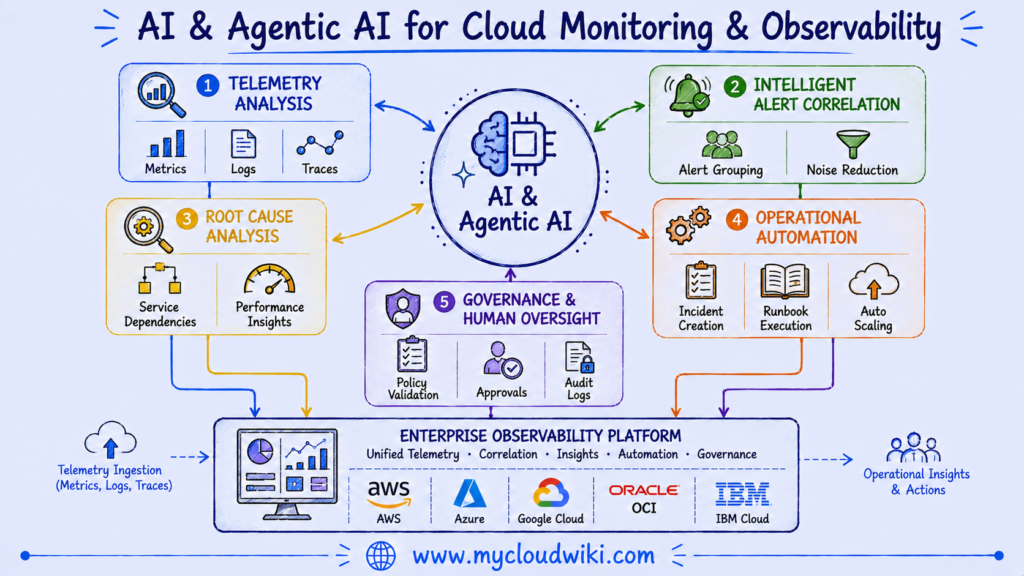
AI enhances operational intelligence, while Agentic AI helps coordinate approved operational activities. Together they improve observability without replacing the governance and accountability provided by experienced engineers and architects.
Well-Architected Multi-Cloud Monitoring & Observability Strategy
Monitoring and observability should be designed as enterprise capabilities rather than isolated operational tools. A well-architected observability strategy enables organizations to detect issues early, investigate incidents efficiently, and maintain operational consistency across the major cloud providers.
Operational Excellence
- Standardize telemetry collection across cloud providers.
- Define enterprise dashboard standards.
- Create reusable monitoring templates.
- Automate operational health checks.
- Continuously improve observability practices.
Security
- Protect telemetry using least-privilege access.
- Centralize audit logging.
- Encrypt operational data in transit and at rest.
- Monitor privileged activities.
- Govern access to observability platforms.
Reliability
- Monitor service health continuously.
- Build resilient alerting strategies.
- Validate monitoring configurations regularly.
- Eliminate monitoring blind spots.
- Test operational readiness frequently.
Performance Efficiency
- Focus on meaningful telemetry.
- Optimize dashboard performance.
- Reduce unnecessary alert noise.
- Standardize telemetry collection.
- Improve operational visibility continuously.
Cost Optimization
- Remove unnecessary telemetry collection.
- Optimize data retention policies.
- Archive historical operational data appropriately.
- Consolidate monitoring platforms where practical.
- Balance observability depth with operational cost.
💡 Architect’s Tip
Enterprise observability should collect the telemetry needed to support business objectives—not every available data point. Focus on high-value operational insights that improve reliability, security, and customer experience.
The following illustration summarizes how enterprise organizations apply the Well-Architected Framework to build scalable, secure, and governed monitoring and observability platforms across the major cloud providers.
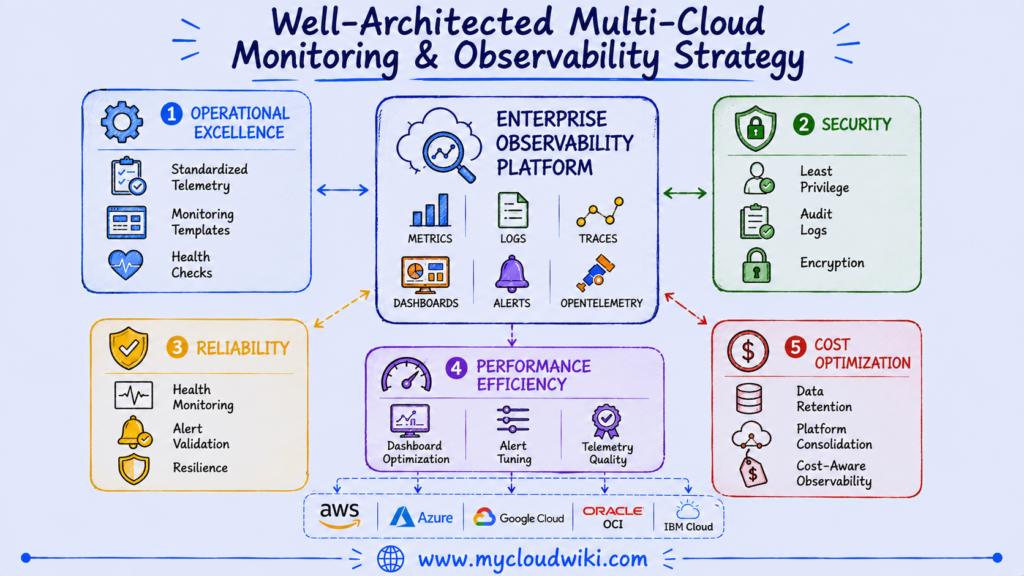
A Well-Architected observability platform provides consistent operational visibility, enabling engineering teams to detect issues faster, improve system reliability, and support business-critical services across multi-cloud environments.
Common Monitoring & Observability Mistakes
Architect’s Notebook — Cloud Monitoring & Observability
Enterprise Challenges
- Standardizing observability across multiple cloud providers.
- Managing increasing telemetry volumes without excessive cost.
- Reducing alert fatigue while maintaining operational awareness.
- Correlating metrics, logs, and traces efficiently.
Lessons Learned
- Monitoring without context provides limited operational value.
- Standardized telemetry simplifies troubleshooting.
- High-quality dashboards are more valuable than numerous dashboards.
- Observability succeeds when integrated into platform engineering.
Enterprise Observations
- OpenTelemetry is becoming the common foundation for enterprise observability.
- AI is improving incident analysis rather than replacing operational teams.
- Centralized observability platforms reduce operational complexity.
- Governance is essential for maintaining trusted operational data.
AI & Agentic AI Notes
- AI accelerates telemetry analysis and root cause identification.
- Agentic AI coordinates approved operational workflows.
- Human oversight remains essential for production environments.
- Intelligent observability platforms will continue to evolve alongside enterprise automation.
The following notebook captures practical lessons learned from designing and operating enterprise monitoring and observability platforms.
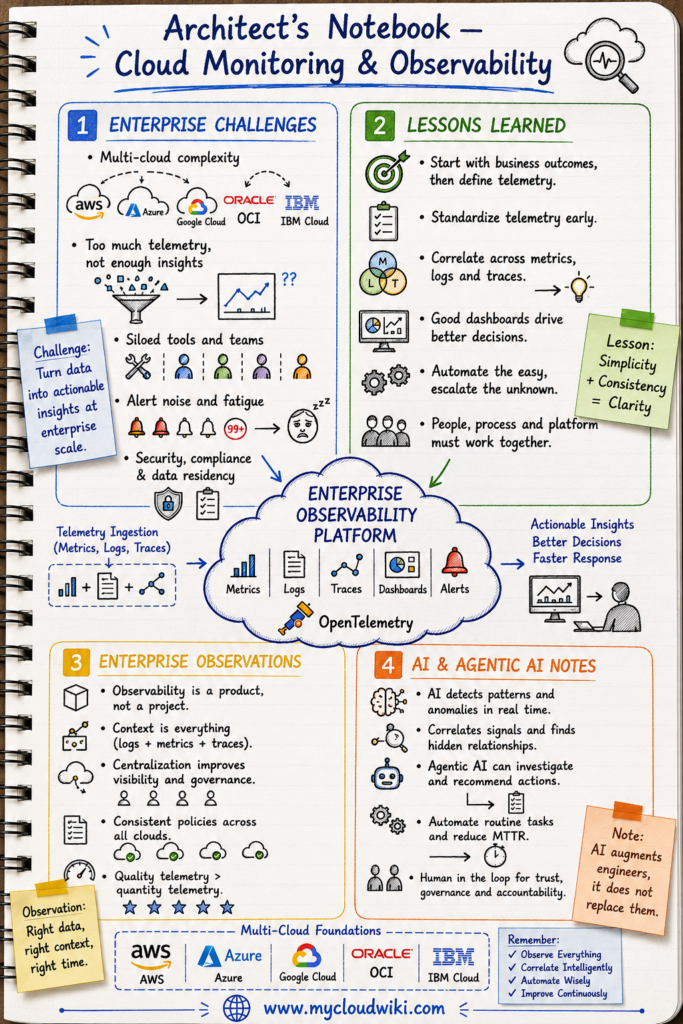
The lessons captured in an architect’s notebook reflect practical experience gained from operating enterprise cloud platforms. These insights help engineers and architects build observability strategies that remain effective as organizations grow and adopt increasingly complex multi-cloud environments.
Key Takeaways
- Monitoring collects operational telemetry, while observability helps explain why systems behave the way they do.
- Metrics, logs, traces, dashboards, alerts, and OpenTelemetry work together to provide comprehensive operational visibility.
- Enterprise organizations standardize observability practices across the major cloud providers to improve governance and operational consistency.
- AI and Agentic AI enhance monitoring by improving telemetry analysis, incident response, and operational efficiency while maintaining governance and human oversight.
- Enterprise architects design observability platforms that enable engineering teams to operate secure, reliable, and scalable cloud environments.
What’s Next
Monitoring tells you what is happening in your cloud environment. The next step is understanding how to manage cloud spending effectively.
Next, read Cloud Cost Optimization (FinOps) Fundamentals Explained Across Multi-Cloud Environments. You’ll learn how organizations measure, allocate, optimize, and govern cloud costs while balancing performance, reliability, and business value across the major cloud providers.

